Crypto Whales Are Loading Up — Are You?
New research shows the biggest crypto buyers are back. And this time? They could hold for the possibility that Bitcoin will surpass $100,000 in 2024. You don’t want to miss the next massive crypto bull run like we saw in 2020 and 2021. To know exactly what’s going on and what to buy… Get Access To Benzinga’s Best Crypto Research and Investments For Only $1.
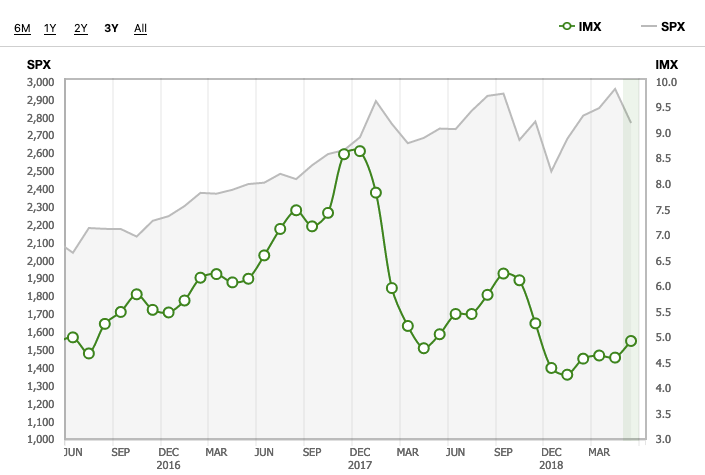
TD Ameritrade clients increased exposure to equity markets during the May IMX period, increasing the IMX score by 6.94% to 4.93, up 0.32 from the previous period.
TD Ameritrade clients were net buyers of equities during the period, increasing their exposure to more risky assets. This helped push the IMX score to the highest level in six months. Net buying of equities reached the highest level since last October. Volatility of the S&P 500 also increased, with the S&P 500 registering four straight weeks of declines to end the period.
ENTER TO WIN $500 IN STOCK OR CRYPTO
Enter your email and you'll also get Benzinga's ultimate morning update AND a free $30 gift card and more!
Equity markets sold off during the May IMX period. The S&P 500 decreased 6.4%, while the Dow Jones Industrial Average declined 6.5%. Pressure in the technology sector caused the Nasdaq Composite to fall 8.5%. Uncertainty over global trade and economic growth were in play, as trade talks with China collapsed, causing much of the anxiety during the period. China announced it would raise tariffs on certain U.S. imports effective June 1 after the U.S. increased tariffs on $200 billion of Chinese goods. As equity markets decreased, many investors turned to safe haven assets such as government bonds. The 10-year Treasury yield decreased by over 35 basis points during the period, ending at 2.14%, the lowest point since September 2017.
Trading
TD Ameritrade clients appeared hungry for new issues during the period. Recent IPOs UBER Technologies Inc. (NYSE:UBER), Beyond Meat Inc. (NASDAQ:BYND), and Pinterest Inc. (NYSE:PINS) were all net buys. Both UBER and PINS reported earnings for the first time during the period, with UBER reporting a $1 billion loss and PINS reporting a loss nearly three times larger than expected. BYND increased over 100% since its IPO amid a plant-based meat craze, with TD Ameritrade clients buying on any weakness. Tesla Inc. (NASDAQ:TSLA) was a net buy once again as the stock reached the lowest point in two years and is off more than 40% in 2019. The company is attempting to ramp up production in China and pass savings on to customers to spur sales. Occidental Petroleum Corp. (NYSE:OXY) was a net buy as it announced final terms to acquire Anadarko Petroleum Corp.
Additional popular names bought include Walt Disney Co. (NYSE:DIS), Canopy Growth Company (NYSE:CGC), and Microsoft Corp. (NASDAQ:MSFT).
Although being net buyers, TD Ameritrade clients did find some names to sell during the period. Facebook Inc. (NASDAQ:FB) was net sold for the sixth month in a row. The company has become a focal point amid big tech antitrust scrutiny from lawmakers, with some calling for a breakup of the company, and traded lower during the period. Bank of America Corp. (NYSE:BAC) also traded lower following revenue concerns on lower interest rates and trading, and was net sold. After reporting strong revenue growth early in the period, ROKU Inc. (NASDAQ:ROKU) hit an all-time high as its market cap topped $10 billion, and was net sold. Wabtec Corp. (NYSE:WAB) was net sold after the company traded lower as it tries to leverage its acquisition of GE Transportation. Widely held General Electric Co. (NYSE:GE) traded higher early in the period after reporting better-than-expected earnings and reaffirming its 2019 forecast, and was net sold.
Additional names sold include Netflix Inc. (NASDAQ:NFLX), Rite Aid Corp. (NASDAQ:RAD), and Anadarko Petroleum Corp. (NYSE:APC).
Inclusion of specific security names in this commentary does not constitute a recommendation from TD Ameritrade to buy, sell, or hold.
Historical Overview
TD Ameritrade's Investor Movement Index (IMX) has generally correlated with the S&P 500 as clients react to equity price movements, but the index has gone through uncorrelated periods. Beginning in January 2010, when TD Ameritrade started tracking the IMX, the index rose with equity markets until April 2010, when it peaked at 5.40. In May 2010 investors experienced the "Flash Crash" and the IMX began a sharp downward trend. The IMX didn't reach 5.00 again until the S&P 500 was well above April 2010 levels. The index eventually peaked at 5.56 in June 2011. This peak was immediately followed by a plunge in equity markets, and in the IMX, as the media was dominated by the U.S. debt ceiling debate, S&P downgrade of U.S. debt, and European debt concerns. The S&P 500 began to recover in the fall of 2011, but the IMX continued to decline until it reached a new low at the time in January 2012. As the S&P 500 began to sustain an upward trend in early 2012, the IMX started to rise. In 2013, as economic conditions improved and the S&P 500 climbed to record levels, the IMX rose to the high end of its historical range, finishing 2013 at 5.62, and continued to rise in 2014 amid geopolitical tensions related to Ukraine and the Middle East, until seeing slight declines in October and November. By the middle of 2015, the IMX had seen increases, as equity market volatility had reduced to near historical levels while the market continued its upward trend. As 2015 ended its third quarter, volatility had returned to markets, as global economic concerns and speculation around the timing and trajectory of Federal Reserve rate increases seemed to rattle overall equity markets. This uncertainty continued to play a role in the equity markets through the fourth quarter of 2015 and into early 2016. The volatility accompanying this uncertainty abated in the second quarter of 2016 and remained low until late in the third quarter. Just as it had in 2015, the IMX saw increases mid-year during the period of lower volatility. The IMX continued to climb into the fourth quarter reaching 5.83 in October 2016, its highest point in two years. A brief spike in volatility during November, timed around the U.S. presidential election, coincided with a slight pull back in the IMX, which then ended 2016 at the high end of its historical range. The IMX started 2017 with an upward trend and reached an all-time high in March before pausing in April as lower volatility led to a decrease in the IMX. The momentum resumed in May, with the IMX breaching 7.0 for the first time ever in July of 2017. The IMX took another brief pause in September, before following markets higher and breaching 8.0 for the first time ever in November and ending 2017 at an all-time high. Volatility returned to the markets in early 2018, and the IMX decreased for four consecutive months to start the year. The IMX then rebounded in the spring of 2018 and continued higher during the summer on the back of better-than-expected earnings and increasing equity markets. The IMX headed higher during the fall of 2018 as economic growth increased before heading lower in late 2018 as the Nasdaq Composite entered a bear market to end the year. Geopolitical issues were in the headlines during early 2019 as the U.S. and China traded tariffs. The IMX rebounded along with equity markets in the spring of 2019 on optimism of a trade deal with China and the unemployment rate nearing a 49-year low.
Crypto Whales Are Loading Up — Are You?
New research shows the biggest crypto buyers are back. And this time? They could hold for the possibility that Bitcoin will surpass $100,000 in 2024. You don’t want to miss the next massive crypto bull run like we saw in 2020 and 2021. To know exactly what’s going on and what to buy… Get Access To Benzinga’s Best Crypto Research and Investments For Only $1.